
CRAFT Hive Logo


Home About Safety Hub Schedule Contact  
     Workshops Resources Project Examples Tools & Equipment   

Home About Safety Hub Schedule Contact Workshops Resources Project Examples Tools & Equipment Search

 
  • All Projects
  • Jewellery Strand
  • Digital Instruments
  • Data Visualization
Data Visualization
Spotify listening stats
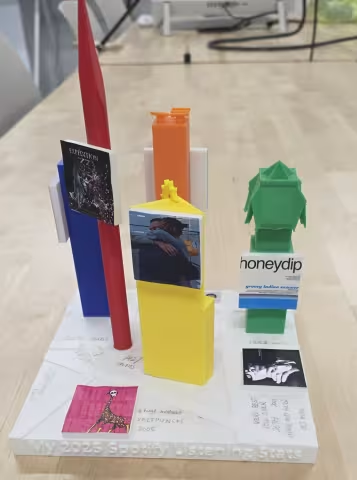
Spotify Miniature Landscape

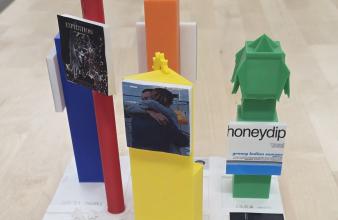
A physical miniature cityscape turning 2025 Spotify listening history into a landscape based on the neighbourhood where the maker grew up. Each building represents a different album, with height scaled to listening time at 1:118 (1 cm = 118 minutes). One district stands out for a single song listened to for over 15 hours. Another represents an album the maker's mother loved — connecting personal memory, place, and listening data into something tangible.

Personal data, Physical sculpture
×
Spotify listening stats
Data Visualization

Spotify Miniature Landscape

A physical miniature cityscape turning 2025 Spotify listening history into a landscape based on the neighbourhood where the maker grew up. Each building represents a different album, with height scaled to listening time at 1:118 (1 cm = 118 minutes). One district stands out for a single song listened to for over 15 hours. Another represents an album the maker's mother loved — connecting personal memory, place, and listening data into something tangible.

Personal data, Physical sculpture
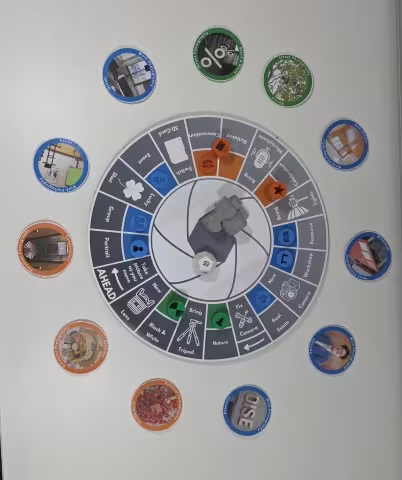
Monopoly game on personal photography data
Photography Monopoly

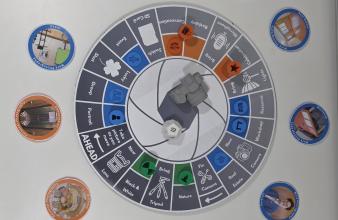
A data sculpture reimagining Monopoly to represent personal photography data — 11 types of photography engaged in from September 2024 to February 2026. Each type is categorized under 3 areas (street, personal, and work) with three different colours. All conventional game components have been remade to be photography-themed, from the board and tokens to dice and cards.

Personal data, Physical sculpture
×
Monopoly game on personal photography data
Data Visualization

Photography Monopoly

A data sculpture reimagining Monopoly to represent personal photography data — 11 types of photography engaged in from September 2024 to February 2026. Each type is categorized under 3 areas (street, personal, and work) with three different colours. All conventional game components have been remade to be photography-themed, from the board and tokens to dice and cards.

Personal data, Physical sculpture
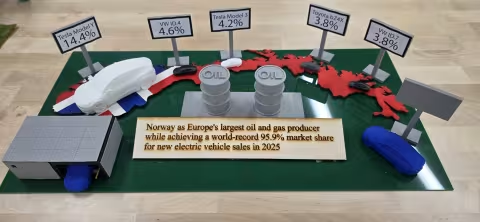
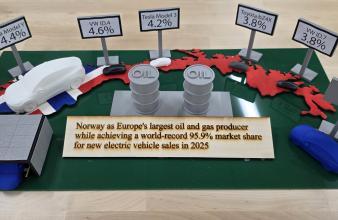
Norway
Norway EV Adoption Map

3D printed EV models and oil tanks on a laser-cut map of Norway, telling the story of a successful green energy transition. Norway leads EV adoption globally while remaining the biggest oil and gas producer in Europe. Revenue from oil and gas has been placed in the Government Pension Fund Global to finance the green transition. This project asks: what can Canada learn from Norway's pragmatic and successful green energy strategy?

3D printing, Laser cutting

×
Norway
Data Visualization

Norway EV Adoption Map

3D printed EV models and oil tanks on a laser-cut map of Norway, telling the story of a successful green energy transition. Norway leads EV adoption globally while remaining the biggest oil and gas producer in Europe. Revenue from oil and gas has been placed in the Government Pension Fund Global to finance the green transition. This project asks: what can Canada learn from Norway's pragmatic and successful green energy strategy?

3D printing, Laser cutting

OISE

Copyright © 2026 The Hive | Thinking Through Making | Ontario Institute for Studies in Education, University of Toronto